Cigarette Smoking and Its Impact (ELC #357 - Using Interactive Charts to Present Data, Facts, and Figures in E-Learning)
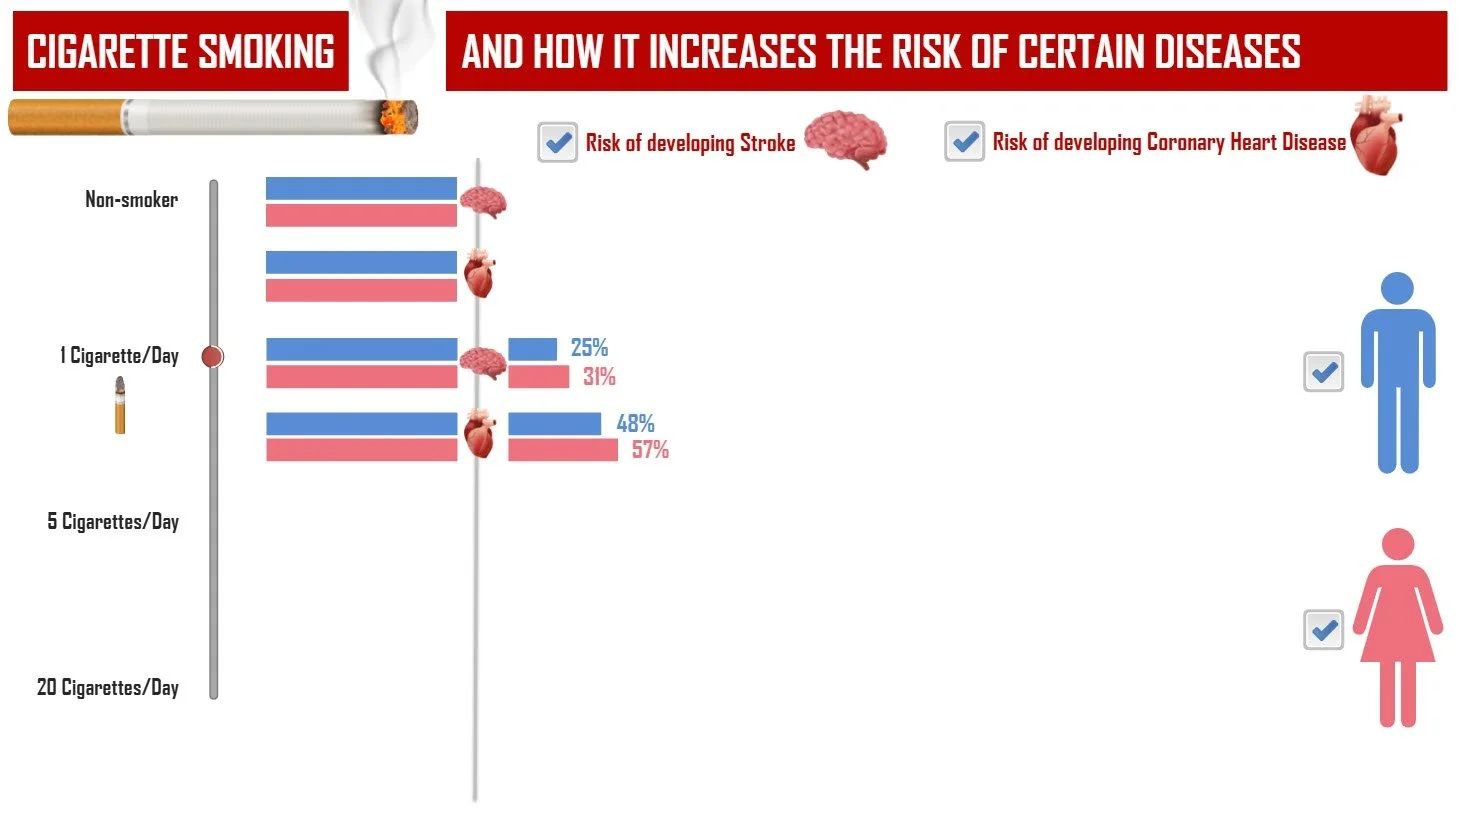
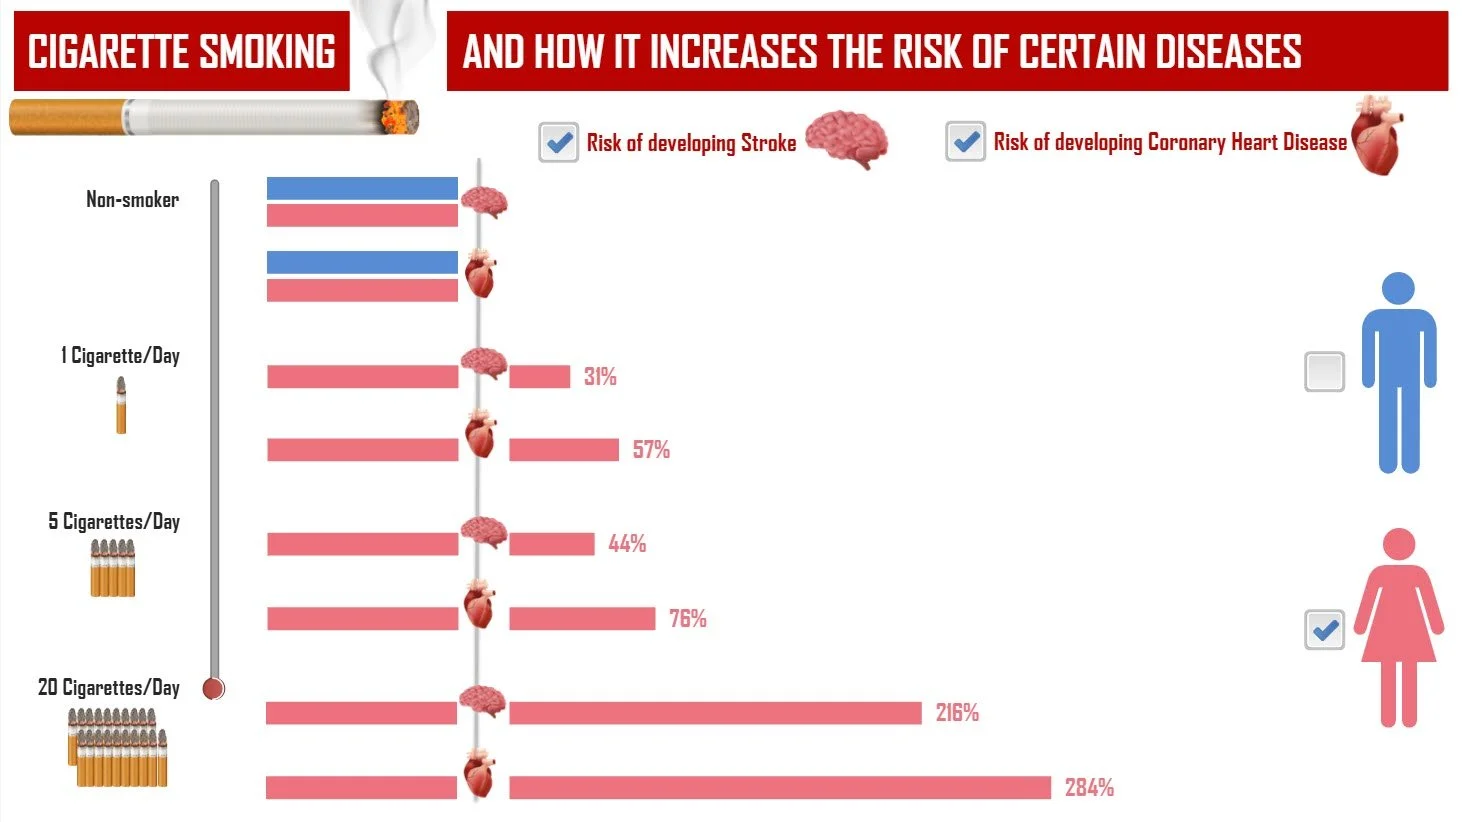
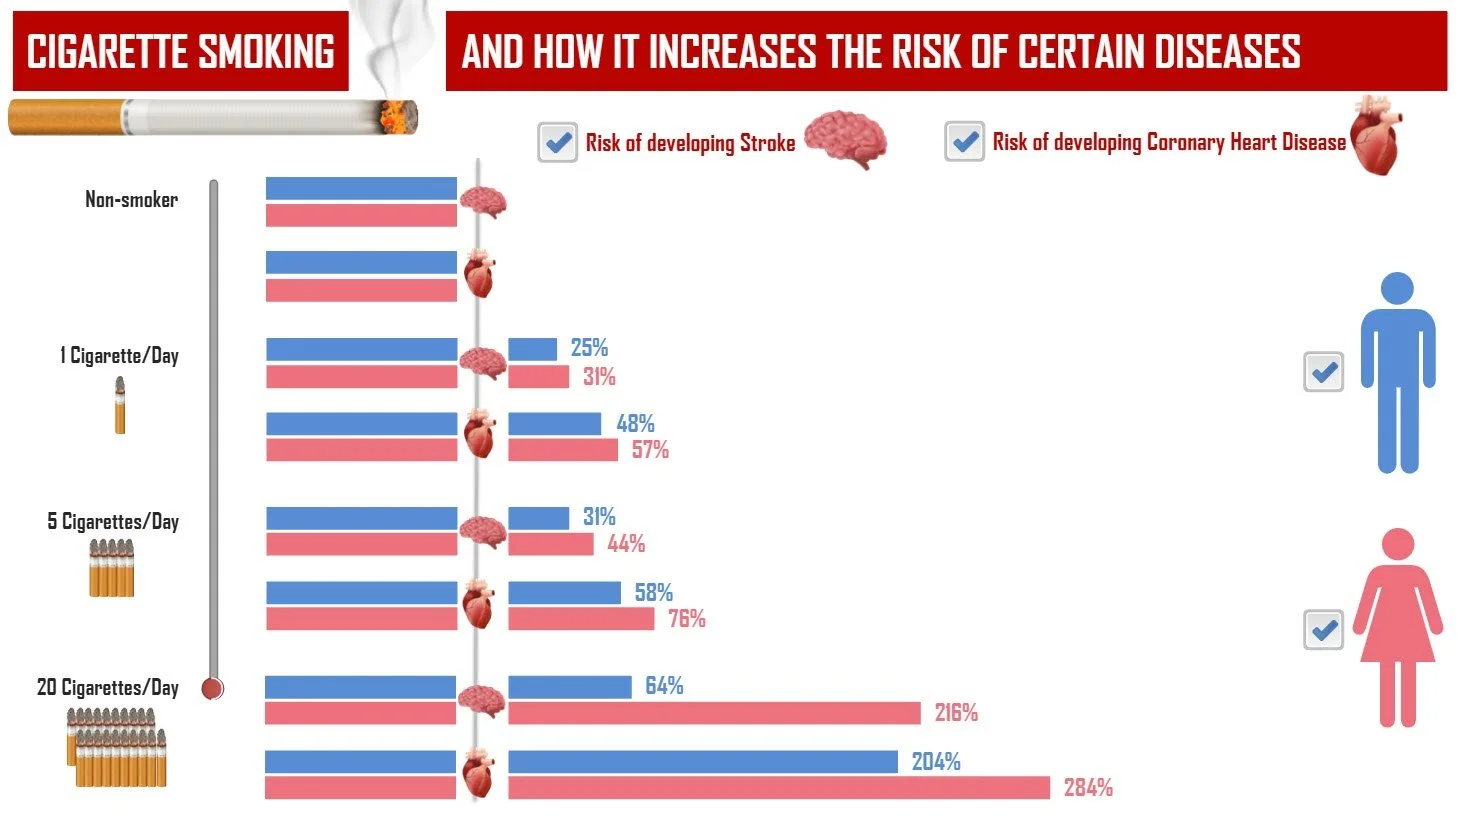
In this e-learning challenge, I designed an interactive chart that demonstrates how cigarette smoking increases the risk of stroke and coronary heart disease in both men and women. Using a slider, checkboxes, and interactive data visualization, users can dynamically explore the results of the study and compare different scenarios.
Click the image to view the sample 👉
Here’s a link to e-learning challenge page
Trailer
Software Used
Articulate Storyline 360, Adobe Illustrator
Highlights
One-slide interactive chart that combines a slider, checkboxes, and dynamic graphs.
Users can move the slider on the left to adjust the number of cigarettes smoked per day and instantly see how risks increase.
Checkboxes at the top and right allow users to toggle between stroke vs. heart disease and male vs. female statistics, for clear comparisons.
Clean, infographic-inspired design with custom icons for diseases, gender, and cigarettes.
A data-driven, engaging way to present complex health statistics in an easy-to-understand interactive format.
Snapshots